Trajectory to Net Zero Emissions
“As a climate leader, it is imperative that Columbia sets an aggressive pathway to achieving net zero emissions, namely by eliminating sources of emissions at a pace consistent with global mitigation pathways that limit global warming to 1.5°C.”
- Radley Horton, Lamont Research Professor in the Lamont-Doherty Earth Observatory; Adjunct Professor of Ecology, Evolution, and Environmental Biology.
Overview
Columbia commits to achieve net zero emissions no later than 2050 on a trajectory such that:
- Total cumulative emissions from 2019 to the date net zero is achieved shall not exceed 14.6 times the University's 2019 emissions.
In addition, Columbia commits to interim emissions reduction targets at a pace consistent with global mitigation pathways including the following 2030 Interim Targets:
- Total cumulative emissions from 2019 through 2030 shall not exceed 9.7 times the University's 2019 emissions.
- Annual absolute emissions shall be reduced 42% from 2019.
- Equivalent to a 66% reduction from the dates of Columbia’s initial commitments to reduce GHG emissions.
One of the guiding principles set forth in the Climate Leadership section is to eliminate sources of emissions at a pace consistent with global mitigation pathways that limit global warming to 1.5°C with limited or no overshoot. This section describes the global pathways that serve as a basis for Columbia’s trajectory and interim targets. It then presents the trajectory and associated interim targets adopted by Columbia.
1. Global Mitigation Pathways
Columbia has relied on information from the Science Based Target initiative (SBTi) and the United Nations Environment Programme (UNEP) in consultation with key faculty at the Earth Institute to understand the characteristics of relevant 1.5o C global mitigation pathways. These characteristics are defined in terms of:
- Maximum cumulative emissions up to the time a state of net zero emissions is achieved, and
- Corresponding annual percent rates of reduction in absolute emissions.
SBTi analyzed the characteristics of 1.5°C global pathway scenarios vetted by the Intergovernmental Panel on Climate Change (IPCC). Each scenario constitutes a hypothetical pathway leading to the desired temperature goal by 2100. All scenarios entail steep decarbonization between 2020 and 2030. SBTi translated each scenario into an equivalent, linear annual rate of reduction from 2020 through 2035. Within this envelope of scenarios, linear annual rates of reduction expressed as a percentage of starting year 2020 emissions [1] ranged from 4.2% to 6%. SBTi also assumes that there is a maximum global cumulative emissions starting in 2018 until a net zero state is achieved: 670 GigaTons (GT) of CO2. [2]
UNEP expresses the required annual rate of reduction as a percent of the emissions in each preceding year from 2020 through 2030. Reduction rates for this period range between 5.6% and 8.8% year over year, with a median value of 7.6%. UNEP determined that, for the period 2018 to the date of net zero emissions, there is a maximum, cumulative global emissions that is lower (600 GT CO2) than that assumed by SBTi.
Columbia relied on the SBTi Minimum Contraction and UNEP Median Contraction scenarios in setting its targets. These reference SBTi and UNEP global mitigation pathways are reflected in Figure 1 below. As one would expect, the more stringent UNEP pathway has a higher probability of temperature limit success (66%) than the SBTi pathway (50%).
Note: It is both SBTi’s and UNEP’s convention to express reductions in absolute emissions as a percent of 2020 emissions; SBTi through 2035 and UNEP through 2030. For the purpose of this plan, it is assumed that a net zero state is achieved in 2050 and that emissions reductions occur in equal amounts after 2035 for the SBTi pathway and after 2030 for UNEP. Cumulative emissions are expressed as a multiple of 2020 emissions based on the respective pathways. Also note that these pathways were defined prior to the COVID-19 pandemic and did not anticipate a decline in global GHG emissions in 2020.
[1] C. Source: “Science-Based Target Setting Manual”, Version 4.1, April 2020, page 25 SBTi.
[2] SBTi bases this on the 50th percentile transient climate response (TCRE) for 1.5o C. Source: “Foundations of Science-Based Target Setting”, Version 1.0, April 2019, page 12, SBTi
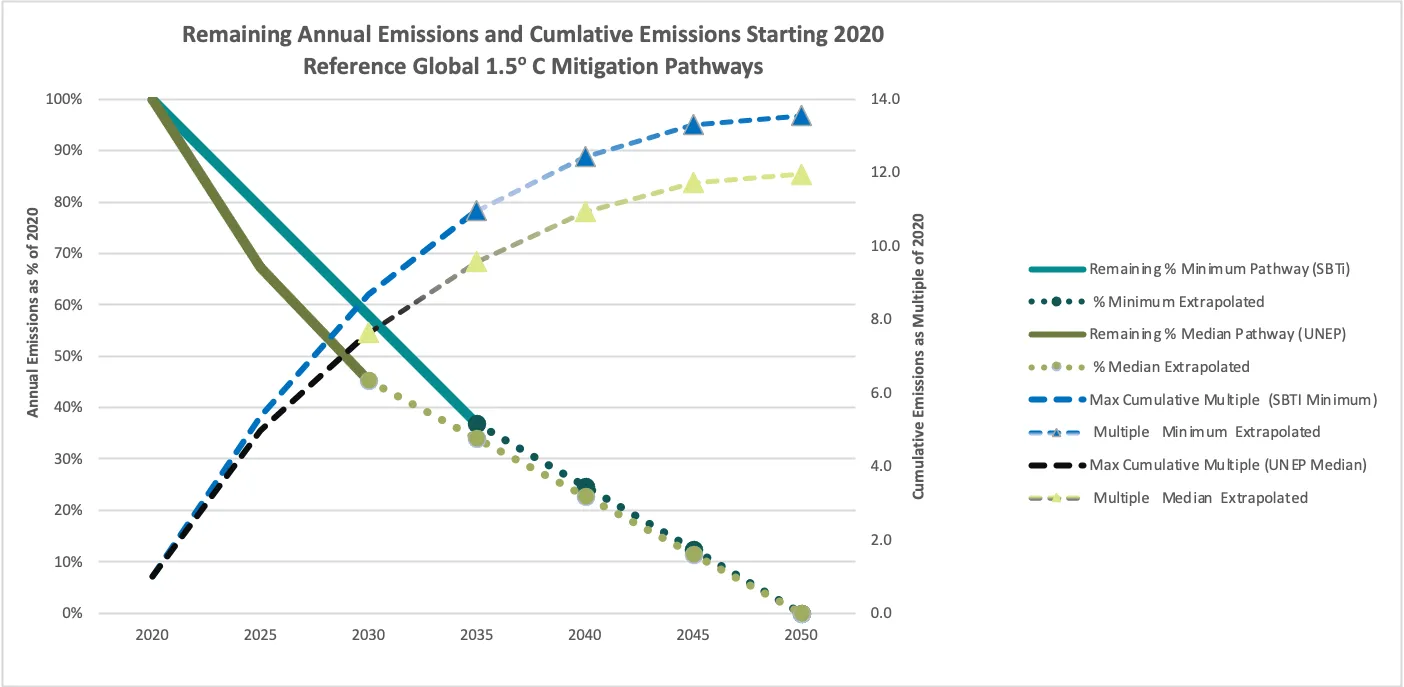
Figure Description: SBTi & UNEP Reference Global 1.5°C Mitigation Pathways, Remaining Absolute Emissions as % of 2020 and Cumulative Emissions as Multiple of 2020 by Scenario
2. Columbia Interim Targets and Trajectory: Scope 1 and 2 Sources
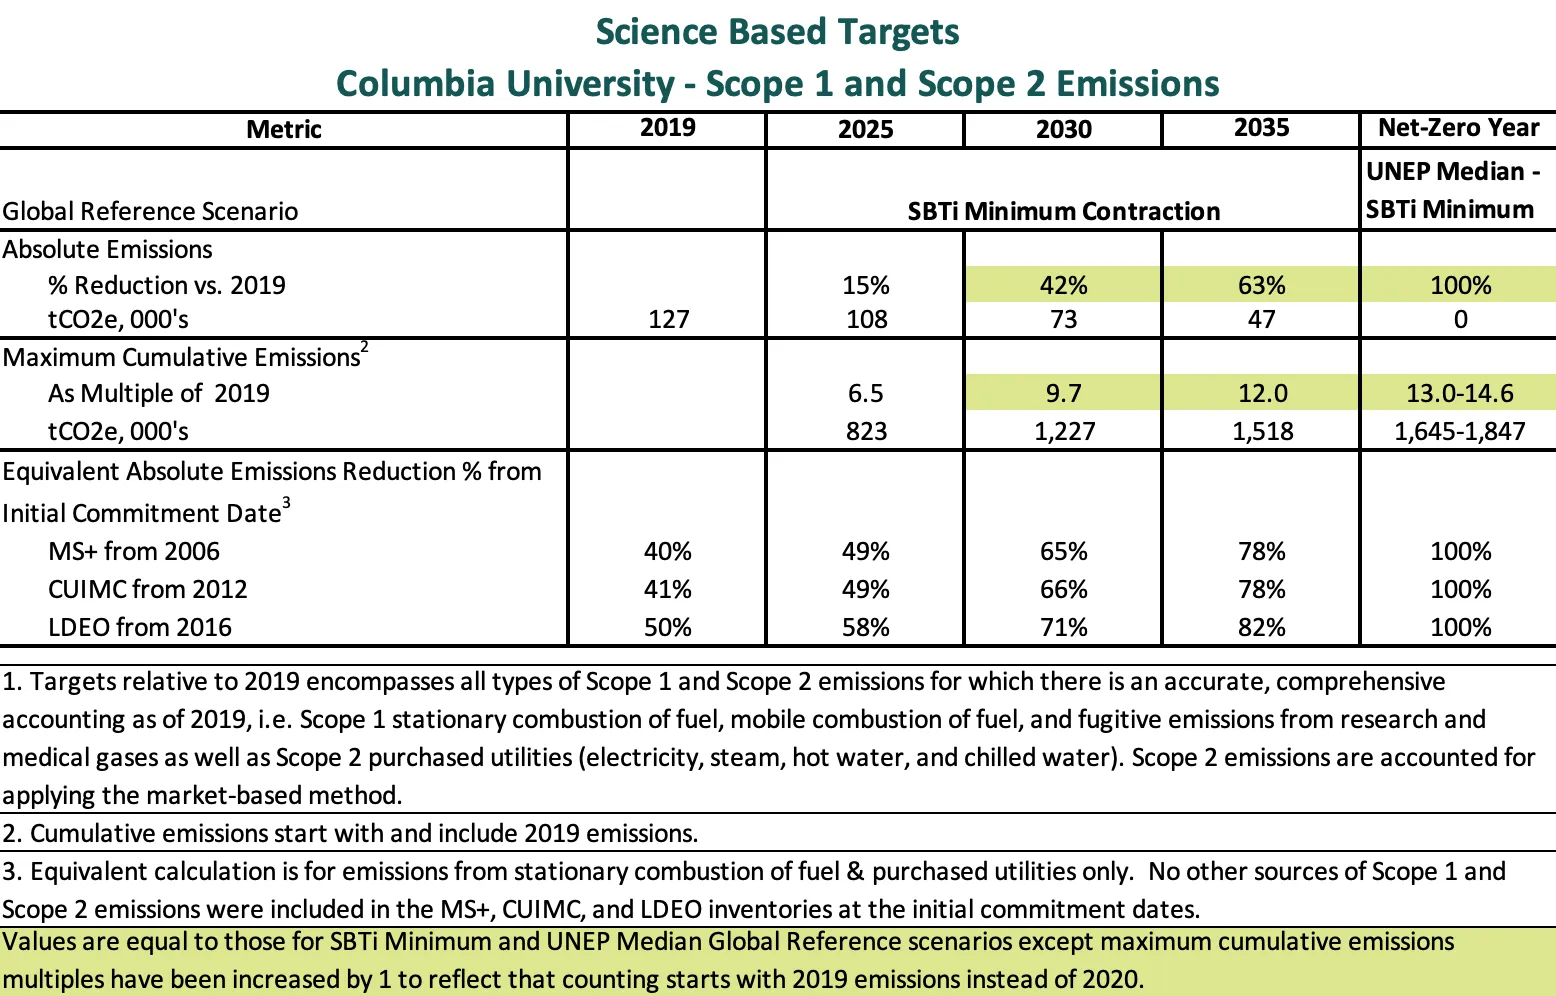
This plan sets forth targets for Columbia for the years 2025, 2030, and 2035 and for the year in which net zero emissions is achieved. The targets are for total Scope 1 and Scope 2 emissions sources for which accurate, comprehensive data is available as of the end of 2019. The targets are in the form of:
- Maximum cumulative emissions as a multiple of a “Base-Year” emissions, and
- Reduction in annual absolute emissions as a % of the starting “Base-Year” value.
It is best practice to use the most recent representative year for which emissions data is available as the Base Year. In Columbia’s case, this is 2019. Even when 2020 data is available, it will not be representative because of the impact of the pandemic on operations.
Columbia’s interim Scope 1 and 2 targets for 2030 and 2035 are in line with corresponding cumulative emissions multiples and absolute emissions reduction percentages for the SBTi Minimum Contraction scenario. The 2025 targets are less ambitious to reflect the limited mitigation options available to Columbia over the next few years.
The target maximum cumulative emissions multiple to the point in time when net zero emissions are achieved is expressed as a range. The lower and upper values in the range are consistent with the UNEP Median and SBTi Minimum Contraction scenarios respectively.
Maximum cumulative emissions are expressed as a multiple of 2019 emissions counting 2019 as the first year and assuming 2020 emission equal those for 2020. Absolute emissions reductions are expressed as a % of 2019 emissions. The specific targets are shown in Table 1. For 2030, the maximum cumulative emissions and absolute emissions reductions targets based on a 2019 starting year are 9.7 and 42% respectively.
These targets apply to all types of Scope 1 and Scope 2 emissions for which there is comprehensive, accurate data as of 2019, i.e. stationary combustion of fuel and purchased utilities (electricity, steam, hot water, and chilled water). Where there is not complete data for Scope 1 and Scope 2 emissions as of 2019 (e.g. with respect to fugitive emissions from refrigerants), Columbia will take steps to complete its accounting and establish targets that are in line with the principles underlying Table 1.
Columbia will continue to apply the market-based method to Scope 2 emissions for the purpose of measuring performance against targets. The market-based method best reflects the GHG emissions associated with the choices Columbia makes about its energy supply. In 2019, Columbia’s total Scope 1 and Scope 2 emissions subject to specific targets total 127,000 tonnes of CO2e (tCO2e) applying the market-based method.
Previously, Columbia had set separate objectives for absolute emissions reductions for the campuses included in the Morningside+ (MS+) inventory (Baker, Manhattanville, Morningside and Nevis), Columbia University Irving Medical Center (CUIMC), and Lamont-Doherty Earth Observatory (LDEO). The starting years for measuring performance were different; 2006 for MS+, 2012 for CUIMC and 2016 for LDEO. Table 1 also combines the interim absolute emissions reduction targets, which are based on a 2019 start date, with the progress made to that point by MS+, CUIMC, and LDEO to calculate the equivalent targeted percent reduction from 2006, 2012, and 2016 respectively.
It is helpful to selectively translate the science-based targets based on a 2019 starting point into these equivalents so that the progress Columbia makes from the time of its original commitments to reduce GHG emissions remains visible. The targeted percent reduction from the original commitment dates to 2030 is 66% for MS+ and CUIMC, and 71% for LDEO.
These targets are for the University as a whole (including Morningside+, CUIMC, LDEO). As the universe of mitigation opportunities is identified and studied, Columbia’s overall targets will be structured among individual operating groups to optimize the outcome for the University as a whole. The resulting portfolio of mitigation initiatives undertaken across all operating groups will ultimately put Columbia on an emissions trajectory intended to meet all the targets in Table 1.
Figure 2 and Figure 3 illustrate a simplistic hypothetical trajectory that meets the targets in Table 1. Figure 2 shows the annual trajectory from 2019 through 2030. This trajectory assumes:
- Emissions in 2020 and 2021 are 10% below 2019 levels largely as a result of changed operations due to the COVID-19 pandemic.
- Mitigation measures studied and developed in the years through 2025 (e.g. strategic electrification) are aggressively implemented after 2025 to meet the 2030 targets.
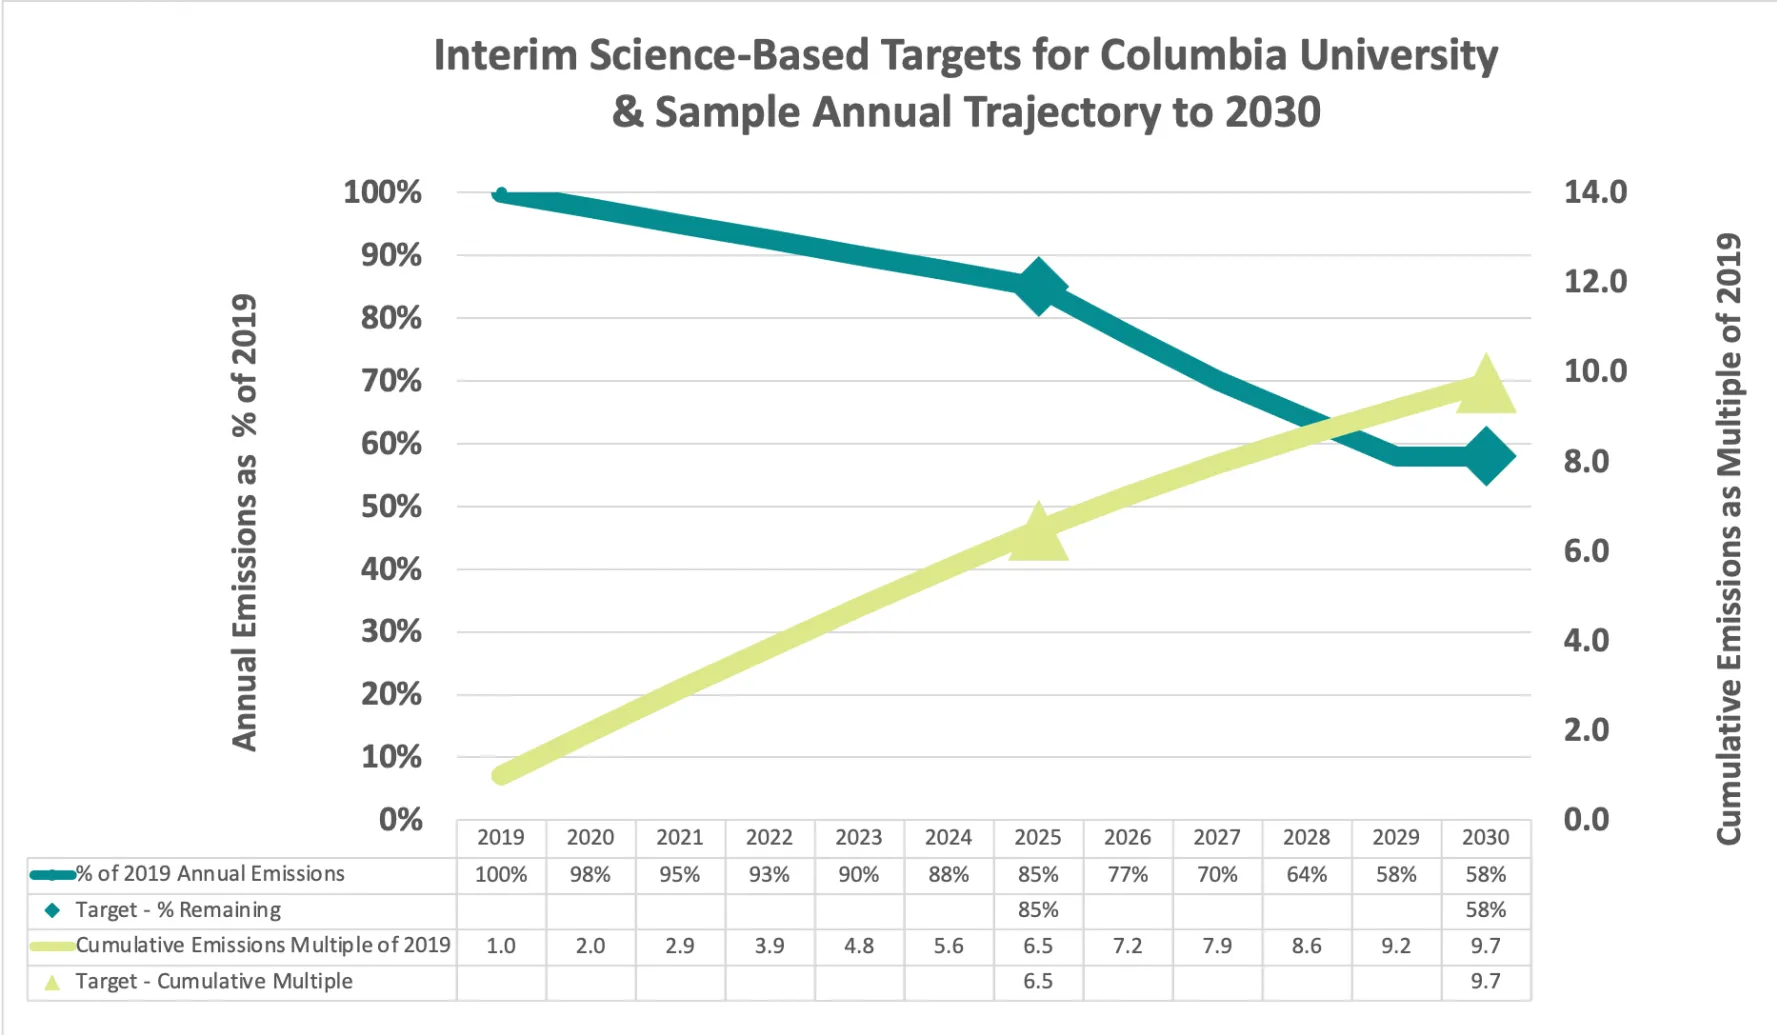
Figure 3 shows the trajectory for 2019 and 2020 and then at 5 year intervals until net-zero emissions is achieved in 2050. This trajectory assumes:
- Same annual pathway as Figure 2 through 2030.
- Equal mitigation increments from 2030 to 2035 to meet the 2035 absolute emissions reduction target, 63% from 2019.
- Equal mitigation increments from 2035 to 2045 to achieve a 95% reduction in absolute emissions from 2019, and then
- Equal mitigation increments from 2045 to 2050 when net-zero emissions is achieved.
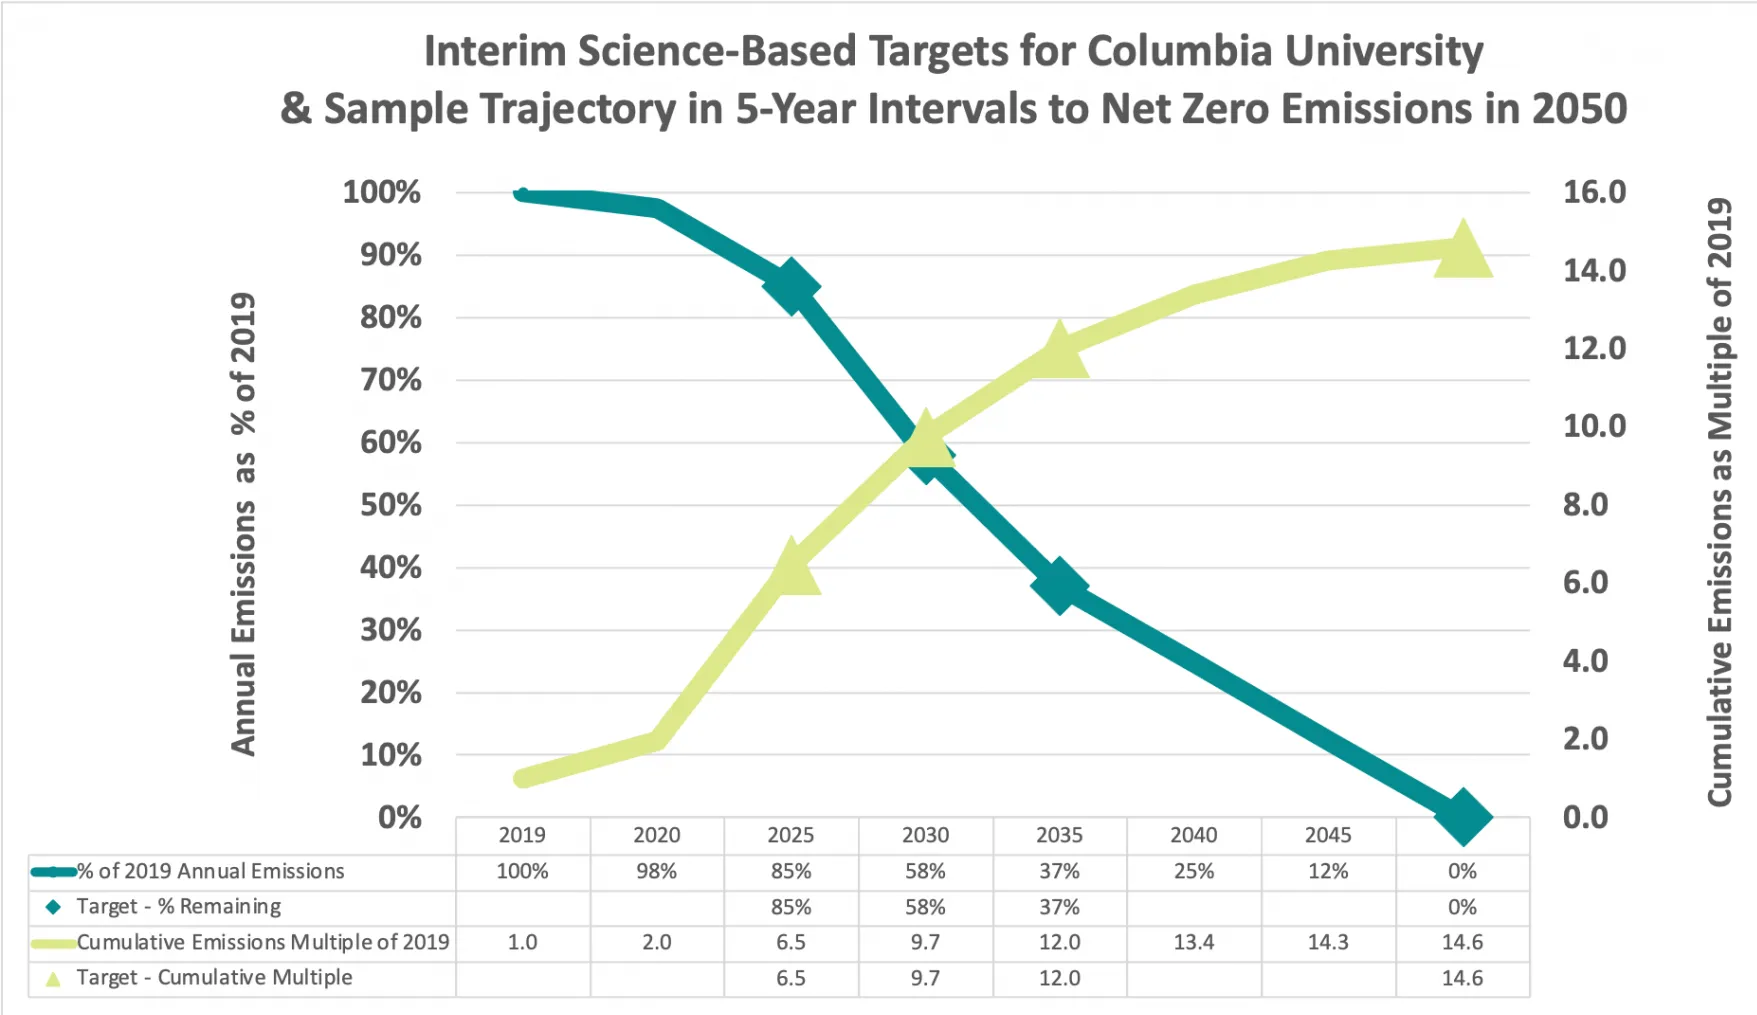
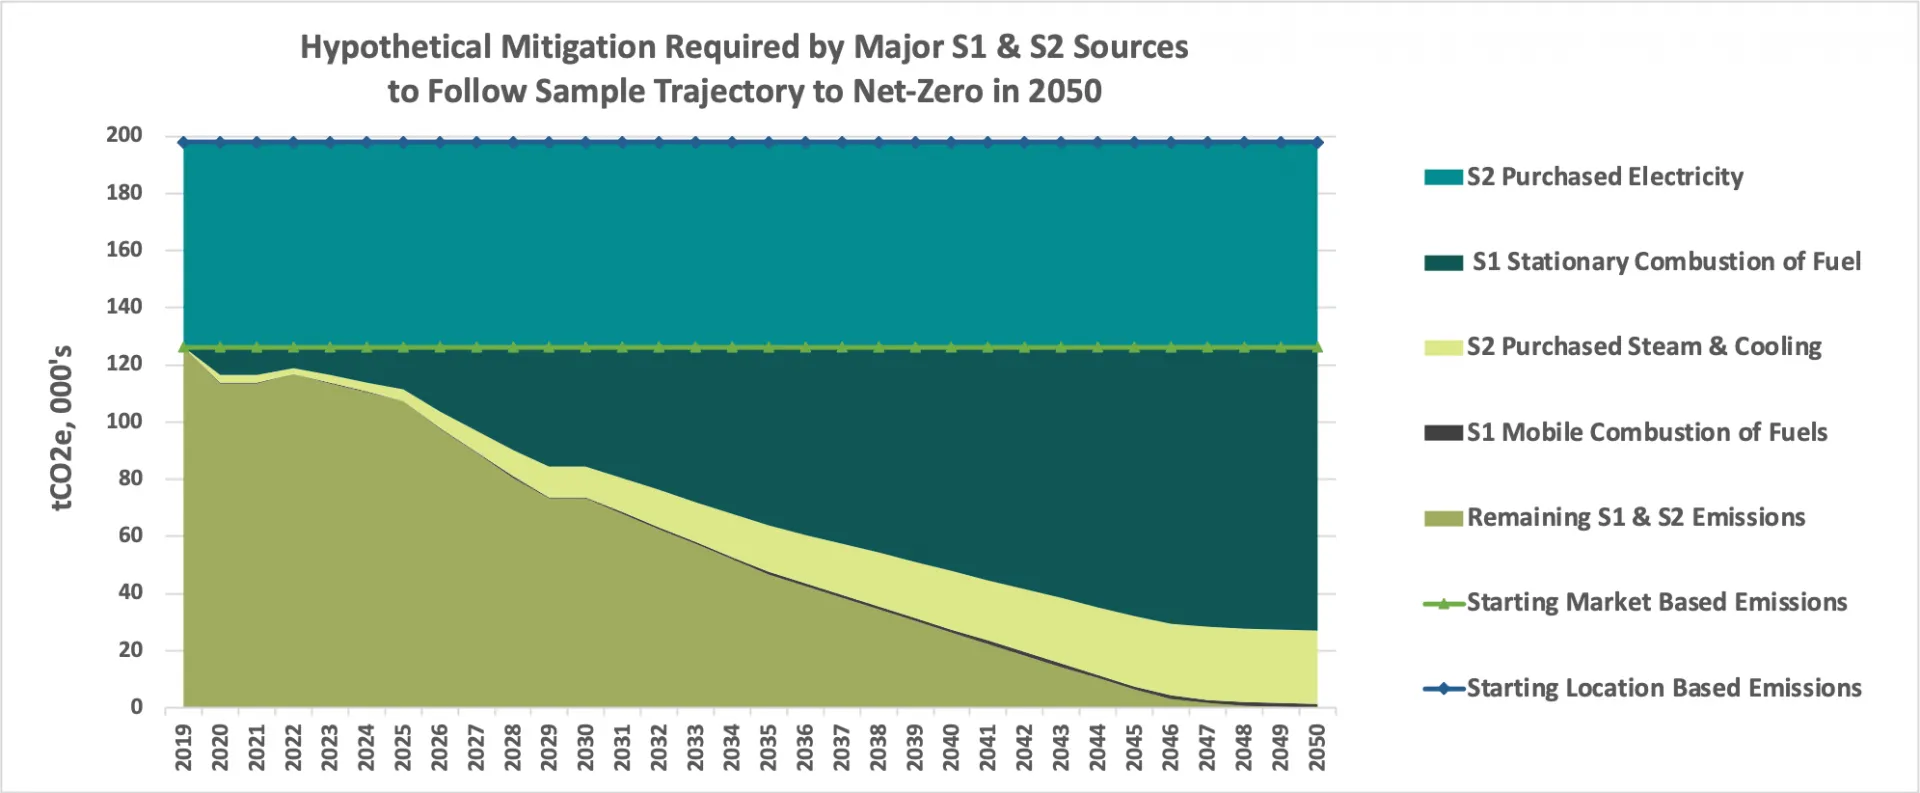
Figure 4 illustrates a summary, hypothetical mitigation pathway in which each of the major types of Scope 1 and Scope 2 emissions is reduced at the same annual rate as for the sample trajectory in Figures 2 and 3. Potential mitigation strategies that may be employed to meet the Scope 1 and Scope 2 science-based targets are discussed in the Campus Energy and Sustainable Transportation sections that follow.
3. Treatment of Scope 3 Emissions
Scope 3 emissions are all indirect emissions not included in Scope 2, and that arise from upstream and downstream activities in Columbia’s value chain. Columbia anticipates completing at least a screening level inventory of all types of Scope 3 emissions in 2022. It is Columbia’s intention to set targets for all material sources of Scope 3 emissions that are in line with the science-based concepts and targets described above for Scope 1 and Scope 2 targets. The exact nature of the Scope 3 targets will vary among emission categories, for example, depending on Columbia’s influence on value chain partners and access to vendor data. Targets will be enforced through procurement specifications to the maximum extent possible.
As of 2019, Columbia reported Scope 3 emissions related to Commuting, Business Travel, Waste from Operations, and Electricity Transmission Losses. Targets for each are discussed under the respective Commitment Area in this Plan. Targets with respect to percent reduction in absolute emissions and multiples for maximum cumulative emissions are the same as for Scope 1 and Scope 2 emissions in Table 1 above for Commuting, Business Travel, and Electricity Transmission Losses.
Key Scope 3 categories yet to be inventoried include, but are not limited to:
- Capital Goods
- Fuel and Energy-Related (not included in Scopes 1 & 2, other than electricity transmission losses)
- Leased Assets
- Purchases of Goods and Services