Breakdown of Emissions Sources
This section addresses the Scope 1 (stationary combustion of fuel) and Scope 2 (purchased utilities) components of campus energy emissions. The graphic below illustrates the following key points.
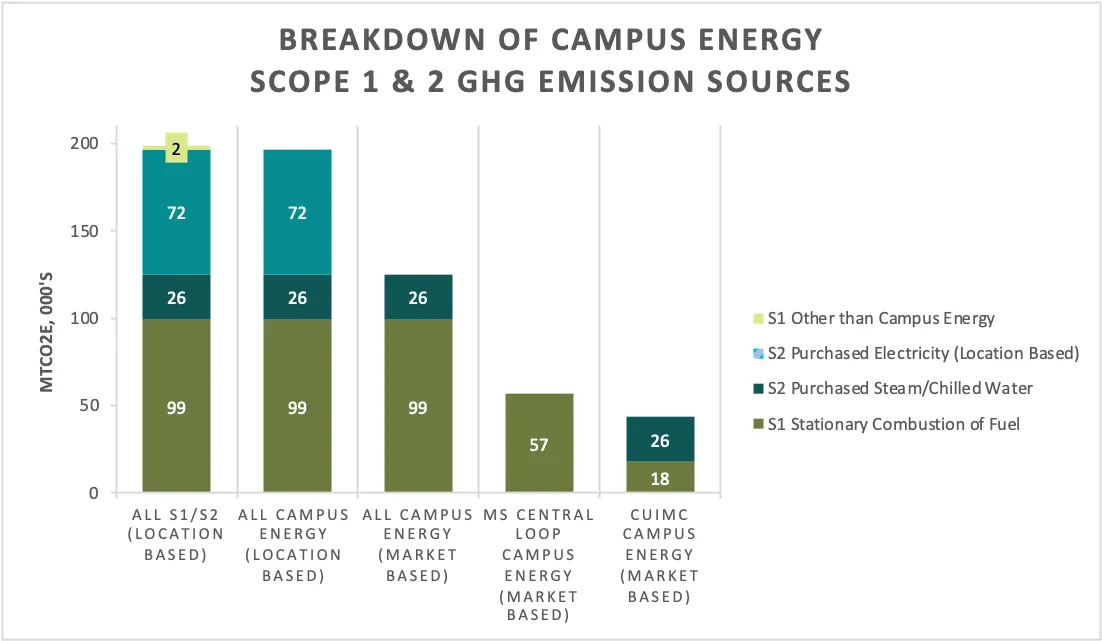
Under the location-based reporting method:
- Campus energy accounts for 99% of total (199,000 tons of carbon dioxide equivalent (tCO2e)) Scope 1 and Scope 2 emissions.
- Other contributors (mobile combustion of fuel, and fugitive emissions from medical and research gases) account for only 2,000 tCO2e.
- Emissions from purchased electricity account for 72,000 tCO2e (36%) of total campus energy emissions (197,000 tCO2e).
Under the market-based accounting method used to set science-based targets (SBT) and measure ongoing performance:
- After application of renewable energy credits (RECs), there are no reported emissions from purchased electricity in 2019.
- Campus energy emissions (125,000 tCO2e) result primarily from the combustion of stationary fuel (99,000 tCO2e, 79%).
- The balance is principally from purchased steam with a small amount from purchased chilled water.
- Stationary combustion of fuel for Morningside (MS) campus buildings connected to the “Central Loop” represents 46% campus energy emissions (57,000 of 125,000 tCO2e).
- Columbia University Irving Medical Center (CUIMC) accounts for 35% of campus energy emissions.
- Only 40% of CUIMC emissions results from stationary combustion of fuel.
- 60% relates primarily to purchased steam with small amounts from purchases of chilled water.
Note: the figure above does not include fugitive emissions related to refrigerants. While this source of emissions is attributable to campus energy, a comprehensive accounting has not been performed, but will be completed by the end of 2022.