Sample Mitigation Roadmap to Net Zero
Wedge Diagram
The wedge diagram is used to show how a suite of mitigation measures might be applied to meet Columbia’s science-based targets (SBT). The annual remaining emissions in Figure X follow the sample trajectory presented in Figures 2 and 3 in the Trajectory to Net Zero Emissions section of this plan. The wedge diagram assumes the following:
Local Law 97 (LL97)-eligible renewable electricity supply will be limited to the existing New York Power Authority (NYPA) hydropower contract until 2024 at which time LL97 supply will increase to one third of Columbia’s total requirement. It will increase to meet all of the requirements of Columbia’s New York City facilities starting in 2030. The balance of Columbia’s electric supply will be from other renewable electricity sources including renewable energy credits (RECs).
Conservation of electricity and combustible fuel will increase by 2.5% of the associated 2019 requirements each year through 2015, a total of 15%, and remain constant thereafter. Further conservation efforts are subsumed in the electrification and deep energy conservation mitigation measure.
COVID-19 impacts operations in such a manner that, in combination with conservation measures, greenhouse gas (GHG) emissions are at 90% of their 2019 levels in 2020 and 2021.
Electrification in combination with deep energy conservation can be phased in to provide the balance of the mitigation required to follow the trajectory until it reaches its practical limit, which occurs in 2044.
Renewable fuel is required to follow the trajectory to net zero in 2050 once electrification and deep conservation reach their limit in 2044.
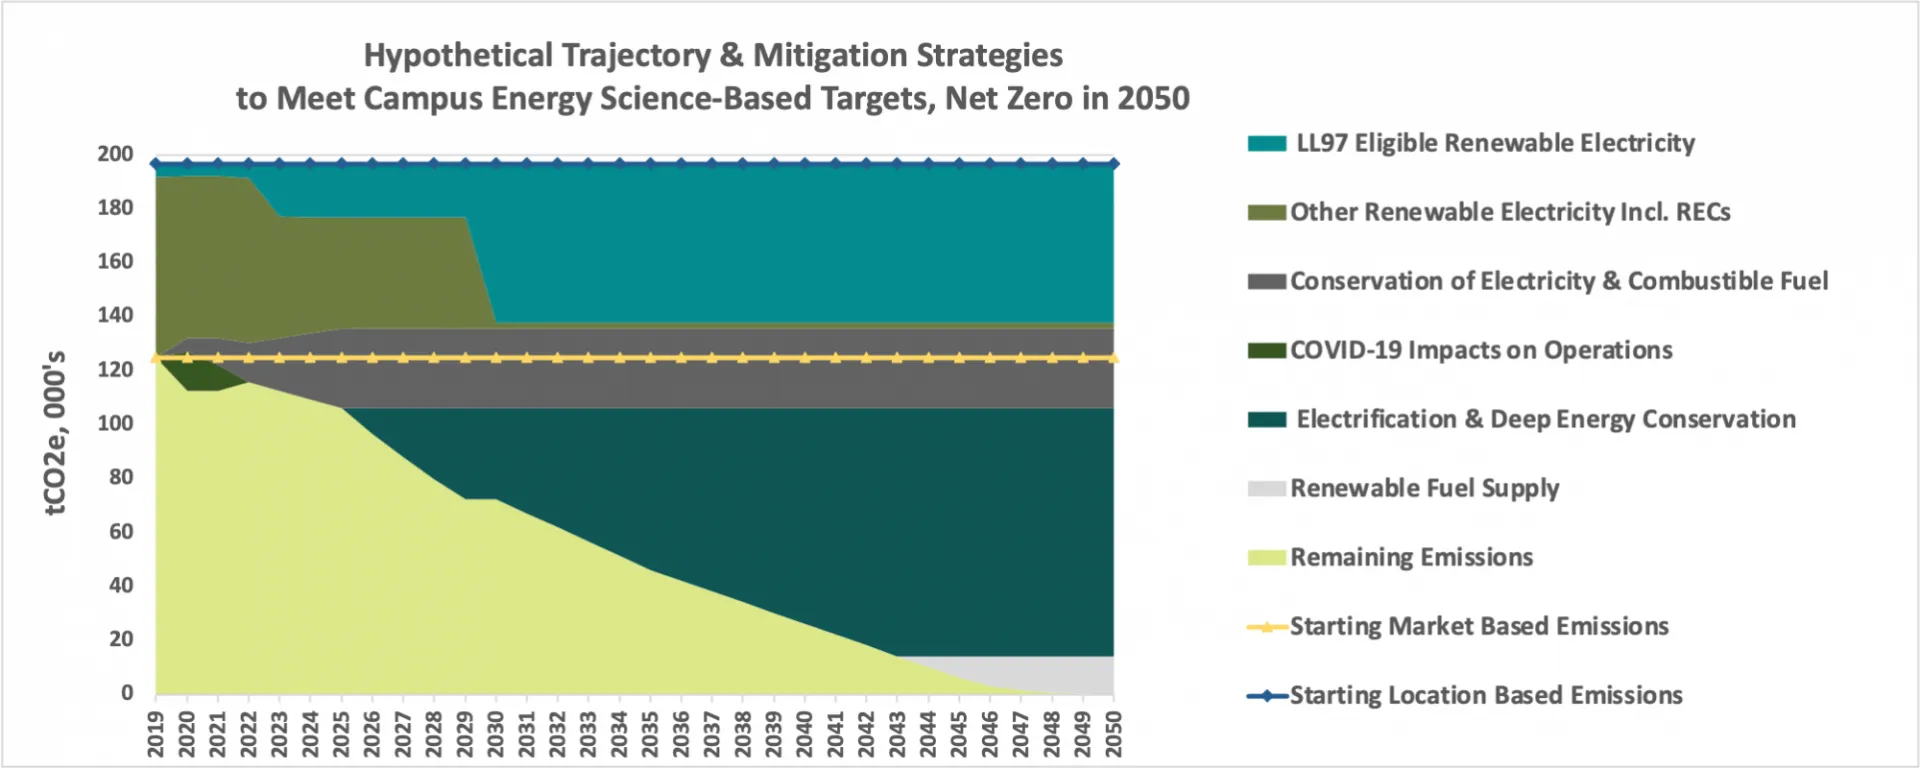
Image Description: Hypothetical application of general mitigation measures to follow the sample trajectory and meet Columbia’s science-based targets.